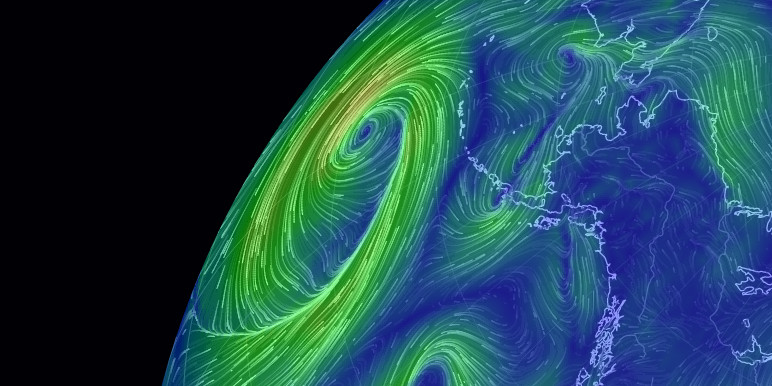
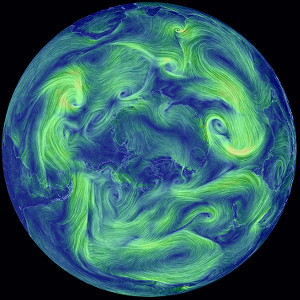
earth
a visualization of global weather conditions
forecast by supercomputers
updated every three hours
ocean surface current estimates
updated every five days
ocean surface temperatures and
anomaly from daily average (1981-2011)
updated daily
ocean waves
updated every three hours
 purchase artwork from Point.B Studio to help support this site
| Community | Facebook Page |
| Author | Cameron Beccario @cambecc |
| Modules |
D3.js backbone.js when.js node.js |
| Weather Data |
GFS (Global Forecast System) EMC / NCEP / NWS / NOAA |
| Ocean Currents Data |
OSCAR Earth & Space Research |
| Sea Surface Temperature |
RTGSST (Real Time Global Sea Surface Temperature) MMAB / EMC / NCEP / NWS / NOAA |
| Ocean Waves |
WAVEWATCH III MMAB / EMC / NCEP / NWS / NOAA |
| Aerosols and Chemistry |
GEOS-5 (Goddard Earth Observing System) GMAO / NASA |
| GRIB/NetCDF Decoder | UCAR/Unidata THREDDS |
| Geographic Data | Natural Earth |
| Hosting |
CloudFlare Amazon S3 |
| Fonts |
M+ FONTS Mono Social Icons Font |
| Color Scales |
chroma.js ColorBrewer2.org Kindlmann Linear Luminance MYCARTA Dave Green's cubehelix |
| Waterman Butterfly | watermanpolyhedron.com |
| Prototype | 東京風速 |
| Inspiration | HINT.FM wind map |
atmospheric pressure corresponds roughly to altitude
several pressure layers are meteorologically interesting
they show data assuming the earth is completely smooth
note: 1 hectopascal (hPa) = 1 millibar (mb)
| 1000 hPa | 00,~100 m, near sea level conditions |
| 850 hPa | 0~1,500 m, planetary boundary, low |
| 700 hPa | 0~3,500 m, planetary boundary, high |
| 500 hPa | 0~5,000 m, vorticity |
| 250 hPa | ~10,500 m, jet stream |
| 70 hPa | ~17,500 m, stratosphere |
| 10 hPa | ~26,500 m, even more stratosphere |
the "Surface" layer represents conditions at ground or water level
this layer follows the contours of mountains, valleys, etc.
overlays show another dimension of data using color
some overlays are valid at a specific height
while others are valid for the entire thickness of the atmosphere
| Wind | wind speed at specified height |
| Temp | temperature at specified height |
| RH | relative humidity at specified height |
| WPD |
Wind Power Density measure of power available in the wind: ½ρv3, where ρ is air density and v is wind velocity |
| TCW |
Total Cloud Water total amount of water in clouds in a column of air from ground to space |
| 3HPA |
3-hour Precipitation Accumulation amount of precipitation over the next three hours |
| MSLP |
Mean Sea Level Pressure air pressure reduced to sea level |
| MI |
Misery Index perceived air temperature as combination of heat index and wind chill |
| SST |
Sea Surface Temperature temperature of the ocean surface |
| SSTA |
Sea Surface Temperature Anomaly difference in ocean temperature from daily average during years 1981-2011 |
| HTSGW |
Significant Wave Height roughly equal to mean wave height as estimated by a "trained observer" |
| COsc |
Carbon Monoxide Surface Concentration the fraction of carbon monoxide present in air at the earth's surface |
| CO2sc |
Carbon Dioxide Surface Concentration the fraction of carbon dioxide present in air at the earth's surface |
| SO2sm |
Sulfur Dioxide Surface Mass amount of sulfur dioxide in the air near the earth's surface |
| DUex |
Dust Extinction the aerosol optical thickness (AOT) of light at 550 nm due to dust |
| SO4ex |
Sulfate Extinction the aerosol optical thickness (AOT) of light at 550 nm due to sulfate |
about ocean waves
Significant Wave Height is the average height of the highest 1/3 of waves at a particular point in the ocean. There's a great writeup here describing what this means.
Peak Wave Period is the (inverse) frequency of the most energetic waves passing through a particular point, whether wind generated or swells. Certainly, there are many more groups of waves moving through an area, each in different directions, but trying to show them all rapidly becomes complex. Instead, we show the one wave group contributing the most energy. This has the effect, though, of creating "boundaries" between regions of ocean where the #1 wave group suddenly switches to second place. Often these boundaries represent swell fronts, but other times they are just artifacts of the ranking mechanism.
about CO2 concentrations
While implementing the visualization of CO2 surface concentration, I noticed the NASA GEOS-5 model reports a global mean concentration that differs significantly from widely reported numbers. For example, from the run at 2015-11-23 00:00 UTC, the global mean is only 368 ppmv whereas CO2 observatories report concentrations closer to 400 ppmv. GEOS-5 was constructed in the 2000s, so perhaps the model does not account for accumulation of atmospheric CO2 over time? This is simply speculation. I am just not certain.
To bring the GEOS-5 results closer to contemporary numbers, I have added a uniform offset of +32 ppmv, increasing the global mean to 400 ppmv. This is not scientifically valid, but it does allow the visualization to become illustrative of the discussion occurring today around atmospheric CO2. Without question, I would welcome a more rigorous approach or an explanation why the GEOS-5 model produces the data that it does.
disclaimer
GEOS-5 data (covering all Chem and Particulates layers) comes with the following disclaimer: Forecasts using the GEOS system are experimental and are produced for research purposes only. Use of these forecasts for purposes other than research is not recommended.
about aerosols and extinction
An aerosol is air containing particles. Common particles are dust, smoke, soot, and water droplets (clouds). These particles affect sunlight primarily through absorption and scattering, which combine to reduce the amount of light reaching the ground. This loss of light as it passes through the atmosphere is called extinction.
One common measure of extinction is aerosol optical thickness (AOT), which is (the log of) the ratio between the power of incoming light and the power of transmitted light. This helps us understand how "thick" the air is with particulates.
keyboard shortcuts
| e | show the menu |
| escape | close dialog/menu |
| k | go forward one time step |
| shift-k | go forward several time steps |
| j | go backward one time step |
| shift-j | go backward several time steps |
| n | go to now (the most recent data) |
| i | go up one pressure level |
| shift-i | go up to the stratosphere |
| m | go down one pressure level |
| shift-m | go down to the surface |
| g | toggle the grid on/off |
| p | toggle the animation on/off |


The GEOS-5 data used on this site have been provided by the Global Modeling and Assimilation Office (GMAO) at NASA Goddard Space Flight Center through the online data portal in the NASA Center for Climate Simulation
weather and ocean data are generated from numerical models
earth.nullschool.net implies no guarantee of accuracy
Copyright (c) 2016 Cameron Beccario